Where is development changing?
Classify land use and land cover, measure built-up growth and compare change through time.
OutputChange maps, area statistics, urban growth indicators and scenario inputs
We turn satellite, aerial and radar imagery into mapped indicators that explain when, where and how land, vegetation, water and structures are changing
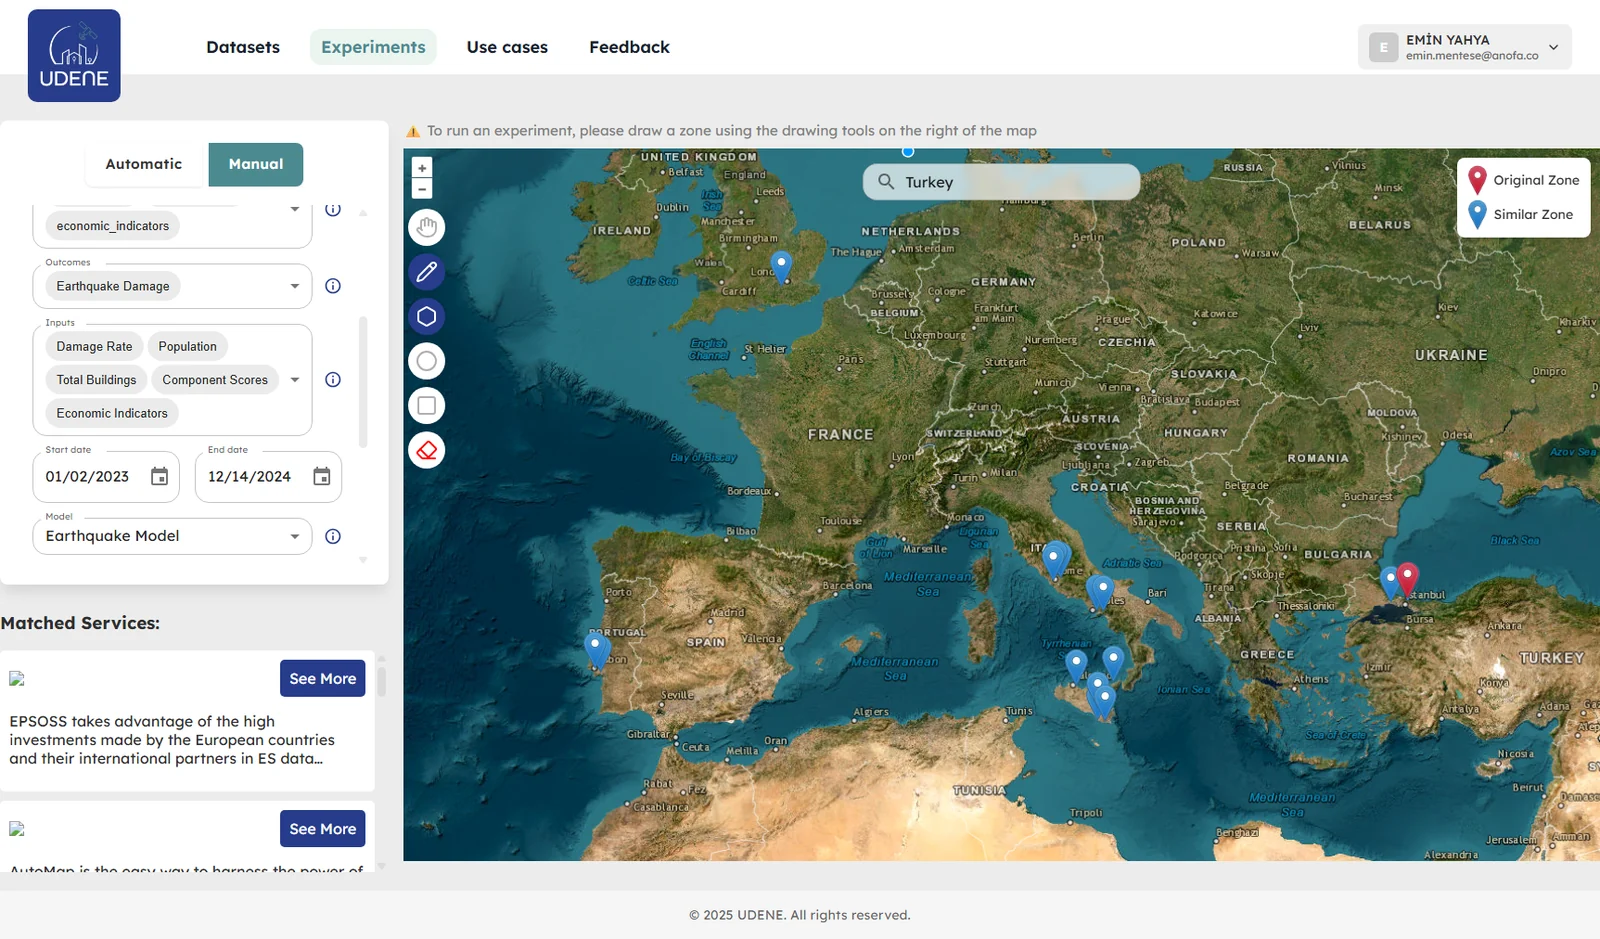
We define the observation period, imagery and validation method around the decision the analysis needs to support
Classify land use and land cover, measure built-up growth and compare change through time.
OutputChange maps, area statistics, urban growth indicators and scenario inputs
Use multi-date spectral indices and time series to monitor crop and vegetation condition.
OutputNDVI, NDMI, NDWI and phenology maps with field or pixel-level summaries
Track water extent, surface signals, pollution-related patterns and landscape change.
OutputComparable observations, anomaly maps and evidence for monitoring programmes
Combine photogrammetry, radar, elevation and shadow analysis to assess structures and rooftops.
OutputDeformation indicators, 3D surface products and rooftop solar potential
Each application turns a defined remote sensing method into an interface that users can inspect and understand
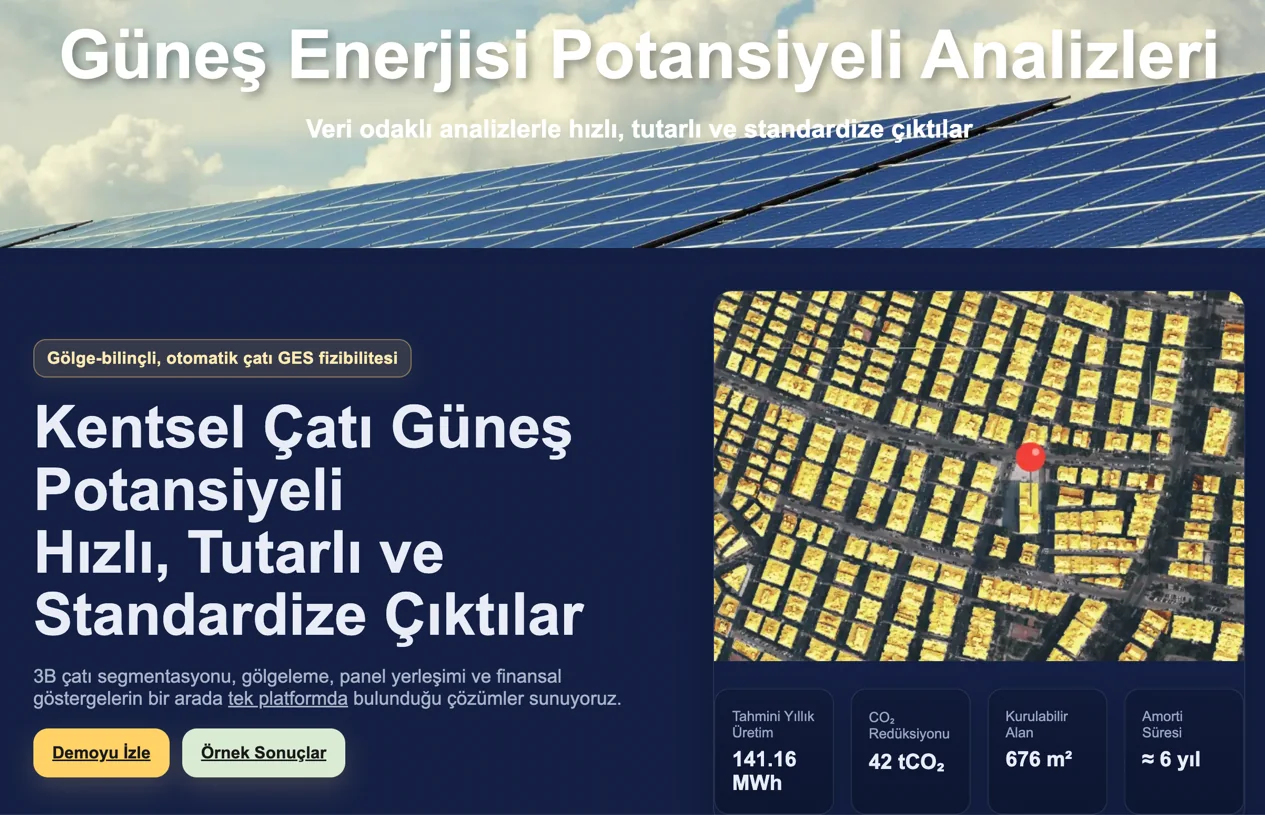
Segment roofs, account for shading, place panels and calculate technical and financial rooftop solar indicators at scale.
Explore Solar →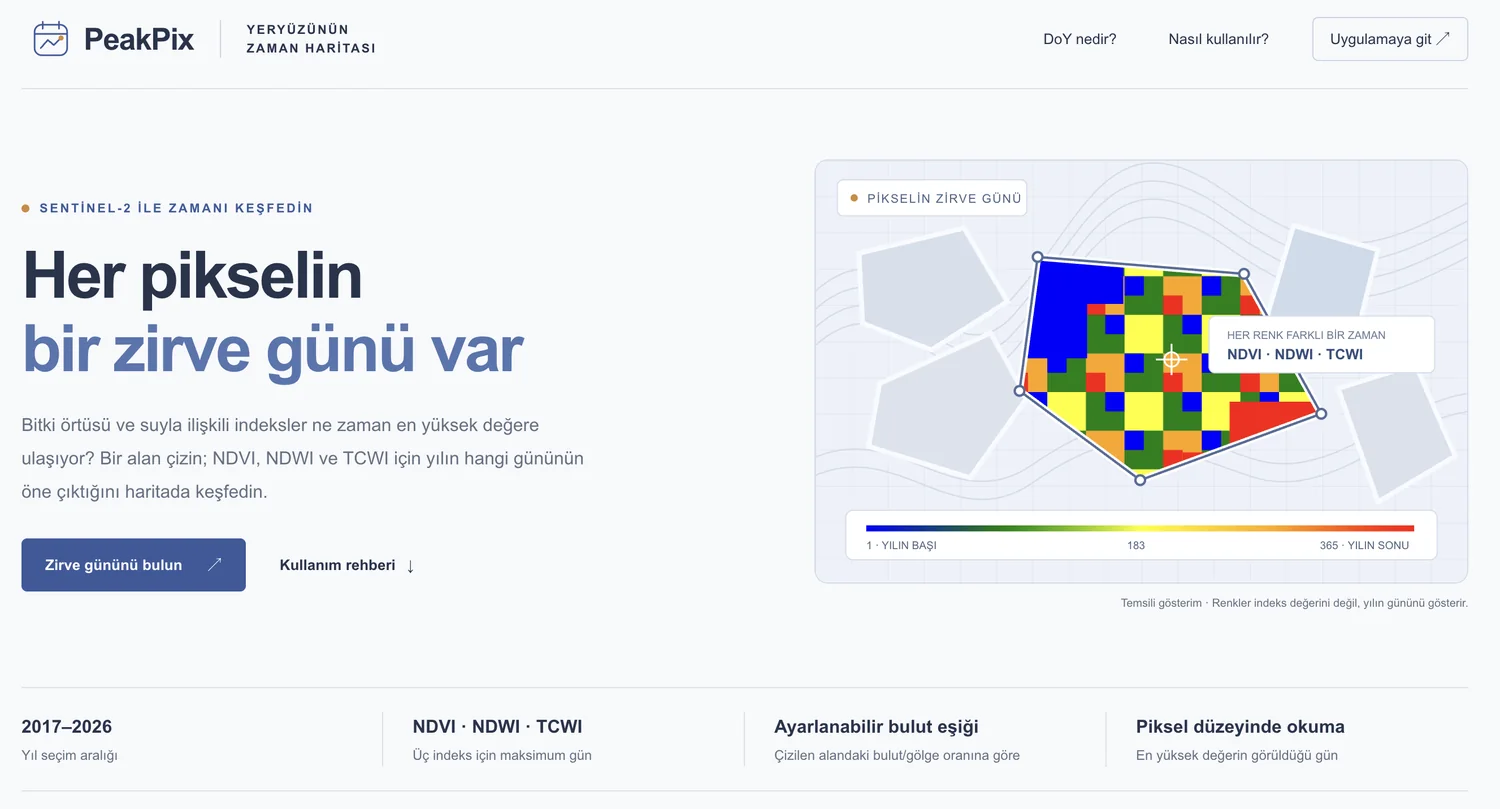
Map the day of year when NDVI, NDWI or TCWI reaches its peak for a selected area using Sentinel-2 observations.
Explore PeakPix →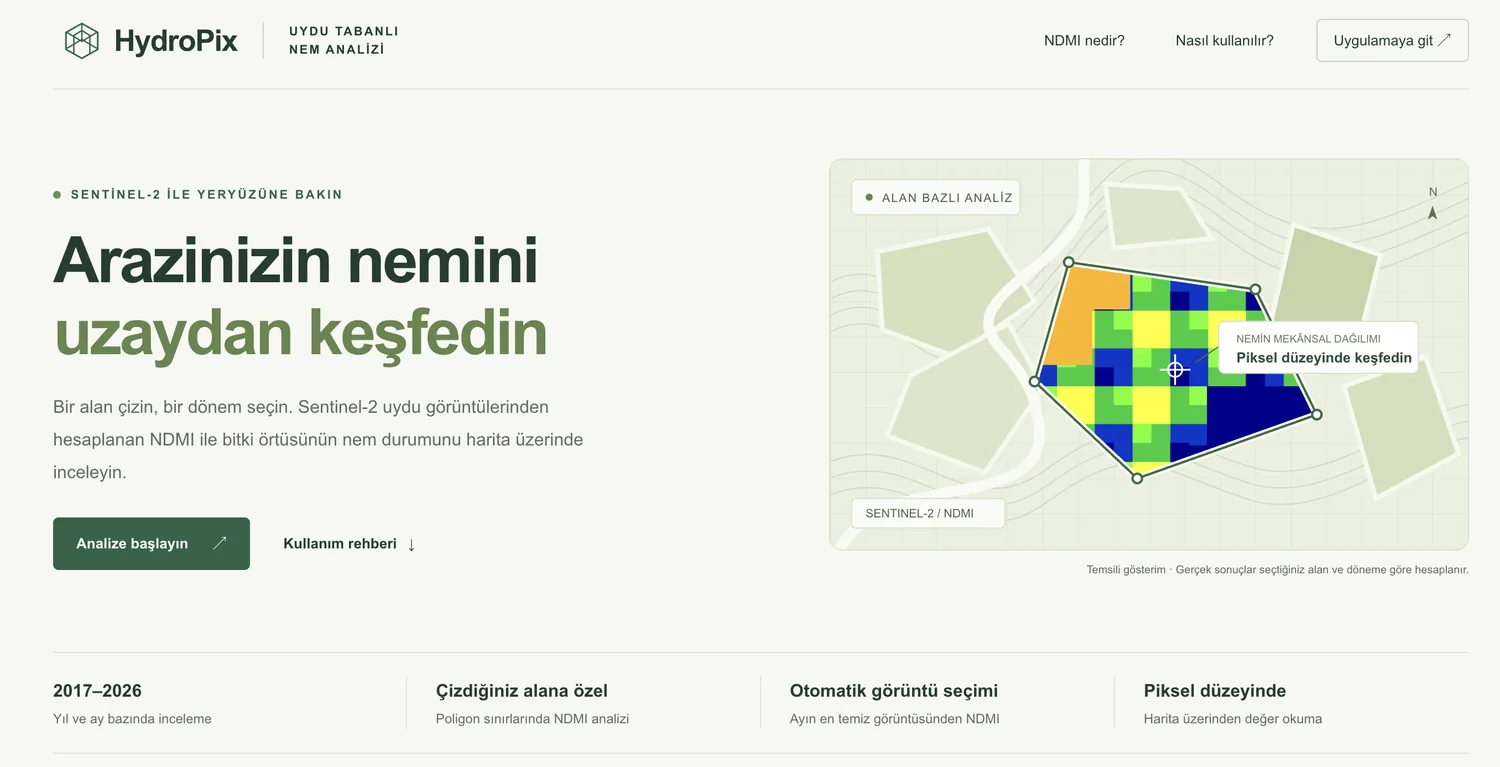
Inspect Sentinel-2 NDMI patterns by month and location to compare vegetation moisture conditions across an area.
Explore HydroPix →Tested the technical feasibility of integrating earth observation and GIS inputs into urban growth scenarios and industrial risk work.
View project reference →The area, period, indicators, imagery and limitations are defined before processing begins.
Analysis-ready rasters, vectors, statistics and visual comparisons show the result and its spatial context.
Receive a report, repeatable workflow, dashboard, API or web application suited to your team.
Tell us about your area, time period and the change you need to measure